By: Nexa Financial Group
“Every time we fall to pieces, we build something new out of the hurt” – Back to Earth, Steve Aoki, 2014
That didn’t take long. Despite all of the fanfare that accompanied the SpaceX IPO that included many investors working strenuously to get pre-IPO allocations, the rocket ship that soared as high as $225 per share in the days immediately post IPO has since come all the way back down to earth. Turns out just one month after the IPO and regular old investors in the public marketplace have the opportunity to buy SpaceX shares below their IPO price of $135 as recently as Wednesday. Does this mean the SpaceX trade is for naught along with the fortunes of Anthropic, OpenAI, and DeepSeek all slated to start gracing out public markets come fall? Not necessarily at all. Lest we forget the Meta Platforms (nee Facebook) IPO back in 2012 at $38 per share. Indeed, it dipped as low as $17.40 per share (down more than -50%) in the months that followed, but it is trading a smidge above its IPO price today fourteen years hence. But the SpaceX stock rocket ship returning to the launchpad is the latest reminder that the IPO game is a mixed bag over time.
Of course, the same cannot be said of the broader stock market over the last few years. Is this Chief Market Strategist bearish about the technology stock outlook over the second half of the year? I do have my genuine concerns, particularly about those semiconductor stocks that have a real SpaceX circa June 18th look about them right now. But when looking at the headline S&P 500 Index, what is not to continue to love.
Yes, the sustained economic growth, inflation pressures in check, earnings growth bursting at the seams fundamental narrative remains firmly in check (until it’s potentially not on that key last of three variables), but check the technicals in the chart above. Four bounces off its 50-day moving average (blue line) support over the past month, and once again we are driving toward new all-time highs north of 7600 on the headline index. Add the Relative Strength Index holding bullishly above the 50 line, and we have all the makings of a stock market that wants to continue higher through the second half of the summer.
But it’s what’s driving the latest stock market bounce since right around the time of that SpaceX IPO that is perhaps even more notable. Consider the winners and losers. Winners? Financials are leading the charge at nearly +8% since June 12 with Industrials, Health Care, and Utilities joining in all north of +3%. Not your usual suspects at all.
Losers on the flip side? Technology and Energy (notable pairing) along with Materials and Consumer Staples (also notable pairing) trading negative since June 12th all. And leading to the downside among them all is the previously blue hot semiconductor industry within the tech sector at down more than -3%.
The good news from these contrasting winners and losers is that we’re no longer seeing the same old same old driving the market to the upside. New leaders taking the market charge gives time for the previous leaders to come back to earth and recharge for their own next move higher. This is the type of healthy rotation that can keep a market moving to the upside.
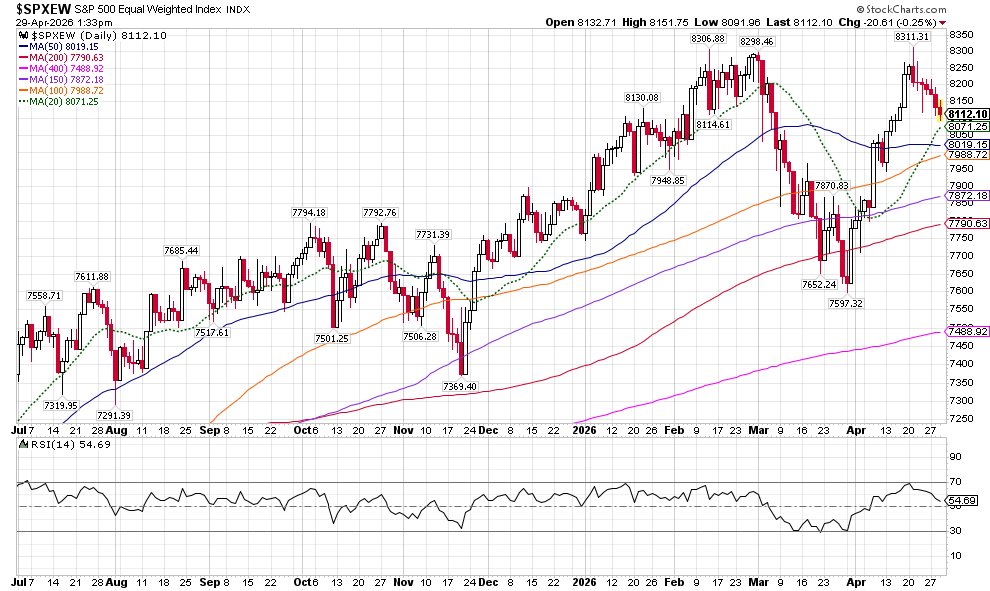
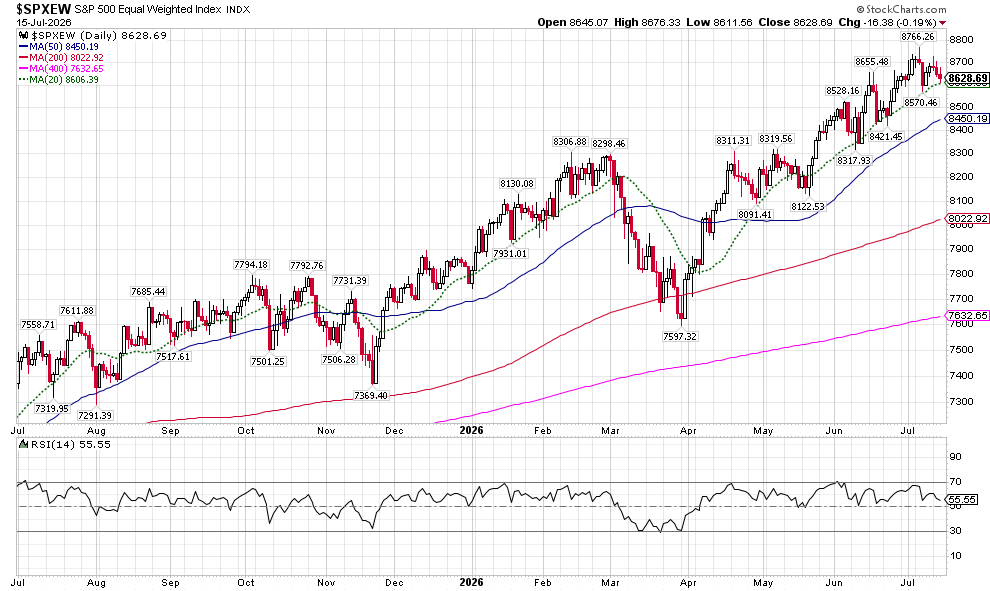
One more positive on the current market before calling it a wrap. For those investors that have been yearning for greater market breadth over the last several years, I present to you the equal weighted S&P 500 Index (Mag 7 stocks and friends are weighted at 0.2% just like everyone else). Put simply, if you liked the resilience of the market cap weighted S&P 500 Index that is fighting its way back to previous highs in the chart above, you’ll love the look of the equal weighted S&P 500 Index shown in the chart above. We don’t need no stinkin’ upward sloping medium-term 50-day moving average support (blue line below) when you have the short-term 20-day moving average (dotted green line) to repeatedly bounce off of six times and counting since late April. This highlights the underlying breadth of performance that is supporting the market through the summer months.
Bottom line. The U.S. stock market is not without its challenges and meaningful downside risks as we continue through the remainder of 2026, and we’ve already seen some much-ballyhooed highflyers recently fall back to earth. But as we continue through the summer months, the good news is that overall stock market conditions remain healthy, strong, and broadly based.
Disclosure: I/we have no stock, option or similar derivative position in any of the companies mentioned, and no plans to initiate any such positions within the next 72 hours. I wrote this article myself, and it expresses my own opinions. I am not receiving compensation for it. I have no business relationship with any company whose stock is mentioned in this article. Investment advice offered through Great Valley Advisor Group (GVA), a Registered Investment Advisor. I am solely an investment advisor representative of Great Valley Advisor Group, and not affiliated with LPL Financial. Any opinions or views expressed by me are not those of LPL Financial. This is not intended to be used as tax or legal advice. All performance referenced is historical and is no guarantee of future results. All indices are unmanaged and may not be invested into directly. Please consult a tax or legal professional for specific information and advice.
LPL Compliance Tracking #: 1131408