Summary
- Inflation is increasingly coming down the other side of the mountain.
- The benefit to stocks will likely take some time.
- The sustained rebound in bonds may already be underway.
We have begun the descent down the other side of the mountain. The long dormant inflationary pressures that erupted nearly two years ago are increasingly subsiding. Assuming this trend continues, this has important implications for the capital markets outlook as we move through the coming year. The impact on some asset classes may take time to materialize, while other categories may already be responding to the effects of gradually diminishing pricing pressures.
Descending from the peak. Pricing pressures appear to be increasingly subsiding. It was nearly two years ago in early 2021 in the monetary stimulus fueled aftermath of the COVID crisis outbreak when inflation began surging higher. The Federal Reserve regarded these pricing pressures as “transitory” at first, which led to a slow-footed policy response that included not only keeping interest rates pinned at zero but the Fed maintaining quantitative easing asset purchases for more than a year later through March 2022. By this time, inflation was raging out of control with the headline Consumer Price Index (CPI) surging by 8.6% on a year-over-year basis and the Core CPI also jumping at a 6.4% annual rate. Both of these readings marked the highest levels seen in the U.S. economy since the notorious stagflationary period of the late 1970s and early 1980s.
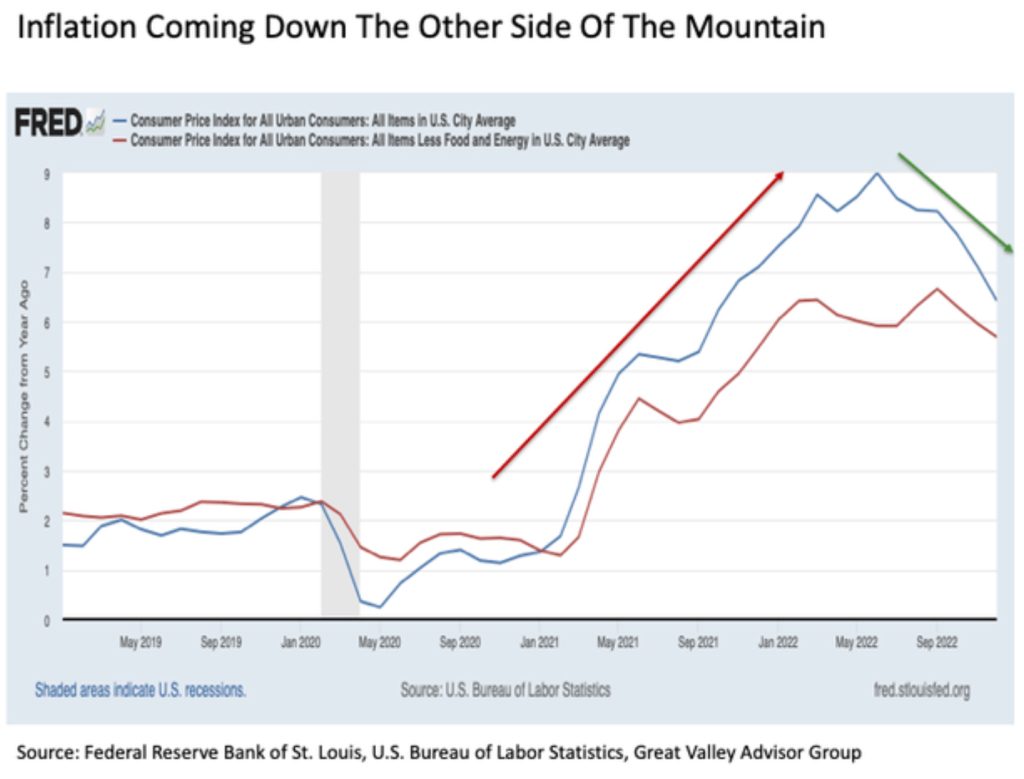
Not long after the Fed finally took decisive action, inflation reached the crest of the mountain. In March, the Fed brought its asset purchase program to a close and delivered its first quarter point interest rate hike. By May it delivered another half point hike, and over the next four Fed meetings from June to November the Fed dropped successive 75 basis point rate increase bombs followed by another 50 basis points in December for good measure. In all, the Fed brought 4.25 percentage points of interest rate increases in just 10 months, which is a breathtaking amount of monetary tightening in such a short period of time.
But during this period of swift rate hikes, the headline CPI peaked at 9.0% year-over-year in June 2022. Since that time, the headline inflation rate has decreased for six consecutive months in falling by more than 2.5 percentage points to 6.4%. finally peaked a few months later in September 2022 at 6.7%, and has fallen for three consecutive months since by roughly one percentage point to 5.7%. Indeed, the inflation rate is still notably high on an absolute basis. But the path of the inflation rate is heading in the right direction, which is positive for capital markets looking out over time. Exactly when and how different segments within capital markets respond to easing pricing pressures will vary across asset classes.
Stocks will likely take time. Stocks have gotten off to lively start to the New Year. Over the first eight trading days in January, the S&P 500 has risen by nearly 4%. While this is certainly a promising start to 2023, stocks continue to face a variety of headwinds that are likely to persist at least over the next few months despite fading inflationary pressures. First, the economy still needs to digest the heavy dose of rate hike medicine administered by the Fed. It typically takes about nine months on average for the impact of a Fed interest rate increase to fully work its way through the economy. This means that several percentage points of rate hikes in recent months are only starting their way through the proverbial snake. It is also important to note that the Fed is likely not yet done with its current rate hike cycle, as it is expected that they will deliver two more quarter point rate increases coming out of their upcoming meetings in February and March before calling it a day.
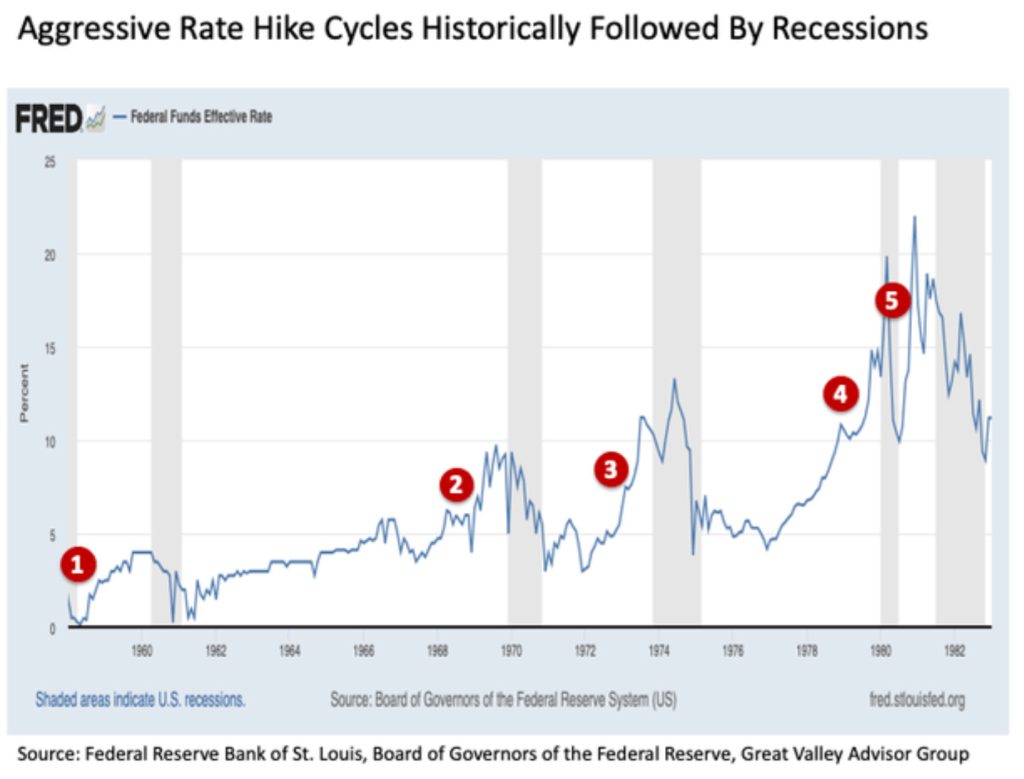
Why does this matter? Because history has shown that when the Fed raises interest rates as swiftly and aggressively as it has in 2022, an economic recession soon follows. Consider the five previous times similar to today when the Fed raised interest rates by four percentage points or more over roughly a one-year period or less. In each of these past five instances, all of which took place between the late 1950s and the early 1980s, the U.S. economy subsequently fell into recession. And put simply, stocks and their underlying corporate earnings typically do not like recessions. Of course, the notion of a recession taking place in 2023 should not come as a surprise, as the inverted yield curve has been predicting an economic recession for many months now.
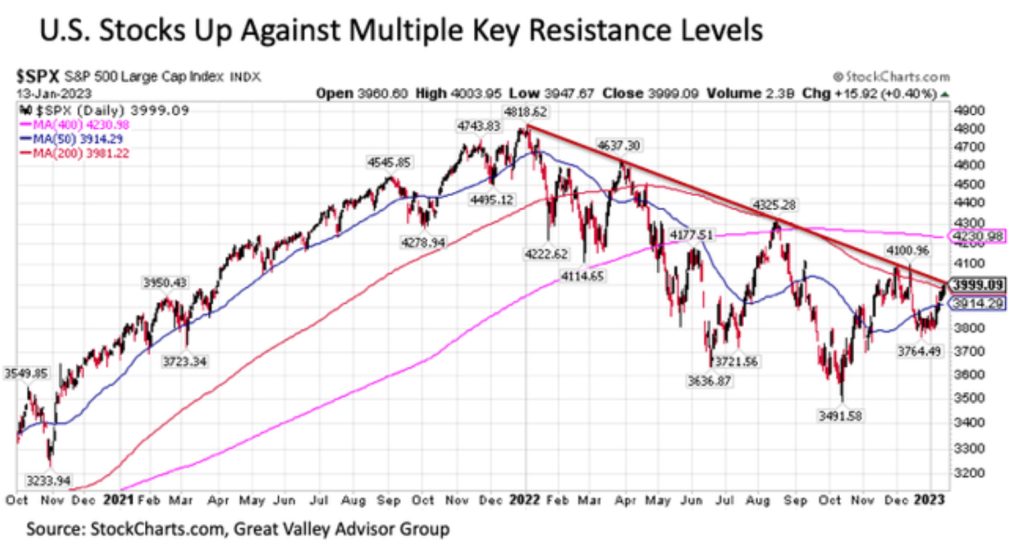
U.S. stocks have also currently arrived at a challenging juncture from a technical perspective at essentially 4000 on the S&P 500. The upside spurt since the start of 2023 has brought the S&P 500 into two key levels of resistance. The first is the 200-day moving average, which turned U.S. stocks back to the downside in both mid-August and early December. The second is the downward sloping trendline of lower highs since January 2022, as stocks have failed to move above this trendline resistance in its four previous attempts dating back over the past year.
It will be worthwhile to monitor U.S. stocks closely over the coming week to see if they can make progress in advancing decisively above these two key resistance levels. Any such breakout would be a constructive development for stocks, with the next major resistance level at the 400-day moving average at around 4230 on the S&P 500. With that said, probability continues to suggest that a pullback from current levels is more likely in the near-term.
Bullish on bonds. The outlook for bonds is decidedly more constructive as inflationary pressures increasingly subside. This is particularly true for U.S. Treasuries. While it could be argued that a bottom in the bond market has already been in the process of being set in recent months, a number of indicators suggest that Treasuries may actually be somewhat behind the curve in rebounding to the upside. This only adds to the developing bullish outlook for Treasuries in the coming months.
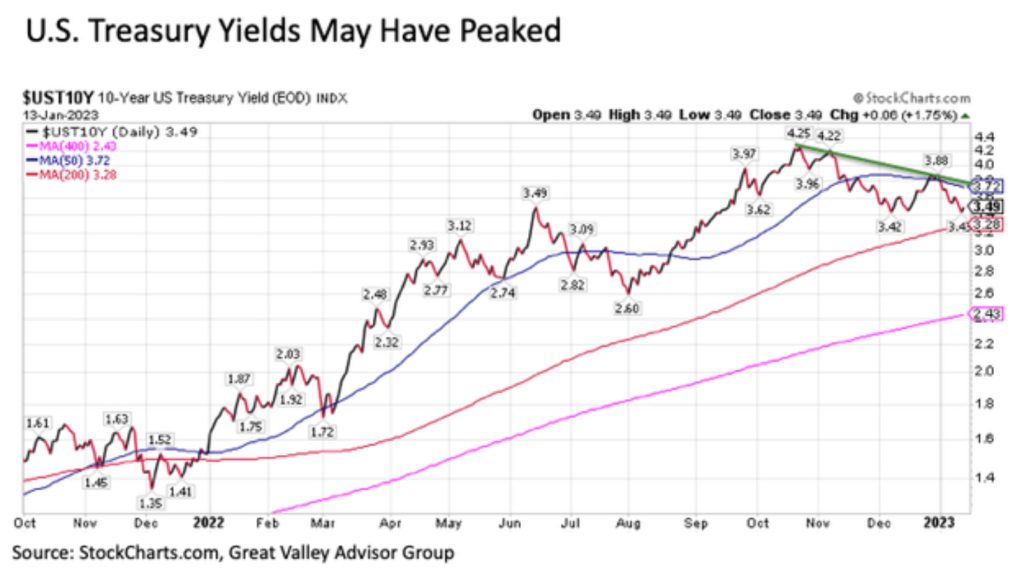
Treasury yields may have peaked a few months ago. The 10-Year U.S. Treasury yield reached a cycle high of 4.25% in mid-October. Since that time, this benchmark yield has fallen by more than 75 basis points to 3.49%. Knowing that bond yields move inversely to bond prices, this represents a meaningful rebound in Treasury prices in recent months after staggering price declines in the time prior since the start of 2022.
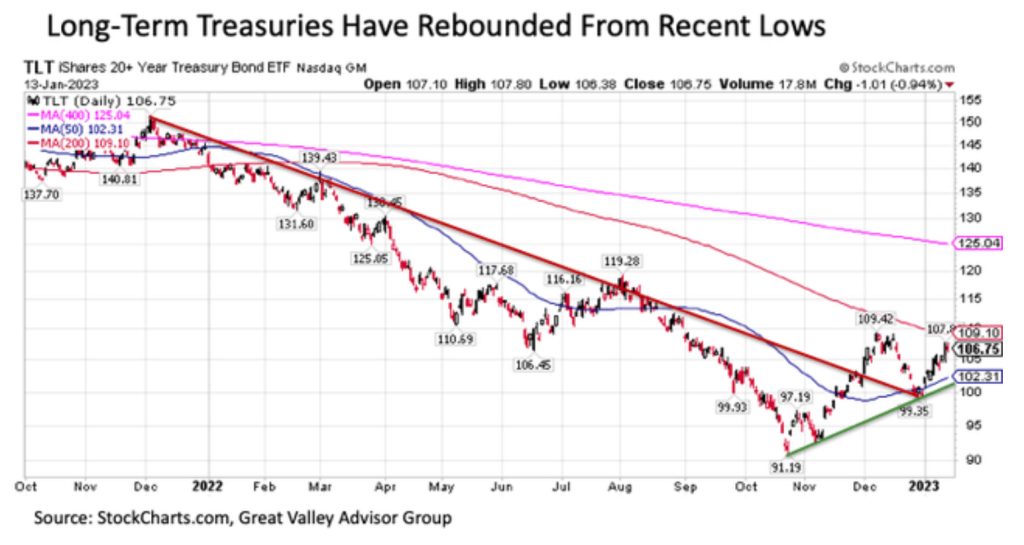
A way to more clearly see the price and total return performance of the long-term U.S. Treasury market is to consider the iShares 20+ Year Treasury Bond ETF (TLT). After bottoming in mid-October, the TLT has rebounded by as much as +20% and is currently higher by +17% above its October lows.
It should be noted that the recent rebound in Treasuries has brought the TLT toward its 200-day moving average, which served as resistance during its previous approach in early December. While this raises an important question about whether Treasuries can continue to advance or if a turn back to the downside is more likely from here, a number of indicators suggest a further advance is more likely going forward beyond any immediate-term volatility.
The first supporting factor for Treasuries is the basic fundamentals. Inflation is the primary determinant of Treasury returns, so the fact that pricing pressures are making their way down the other side of the mountain is increasingly constructive. What about the resulting threat of a recession? While stocks are typically adversely impacted by an economic slowdown, Treasuries actually benefit due to safe haven demand and their secure yields that often eventually become increasingly attractive as the U.S. Federal Reserve eventually lowers short-term interest rates to try and revive growth.
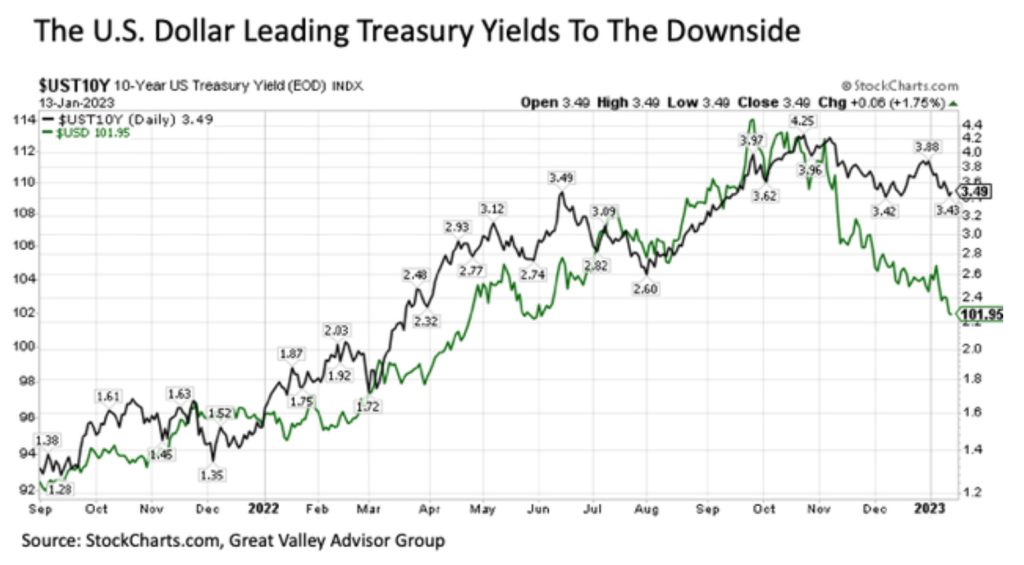
The recent weakening of the U.S. dollar may also be providing a tailwind for Treasuries. It is worth noting that the U.S. dollar and 10-Year U.S. Treasury yields have been moving with notably high correlation over the past couple of years. This relationship could be reasonably explained by several factors including investors migrating to the greenback in recognition of the aggressive monetary tightening undertaken by the U.S. Federal Reserve to major foreign holders of Treasury securities, particularly those emerging market countries that have significant dollar denominated debt and current account deficits, needing to liquidate securities and raise U.S. dollar holdings in order to service their liabilities. Thus, the fact that the U.S. dollar has weakened markedly in recent months may signal relief on this front for the U.S. Treasury market. To this point, major foreign holders of Treasury securities sold more than a half trillion of U.S. Treasuries since the end of 2021 through October 2022 when yields peaked, so it will be worth watching whether these same foreign holdings level out or start to marginally increase once the latest readings for November are released this upcoming week.
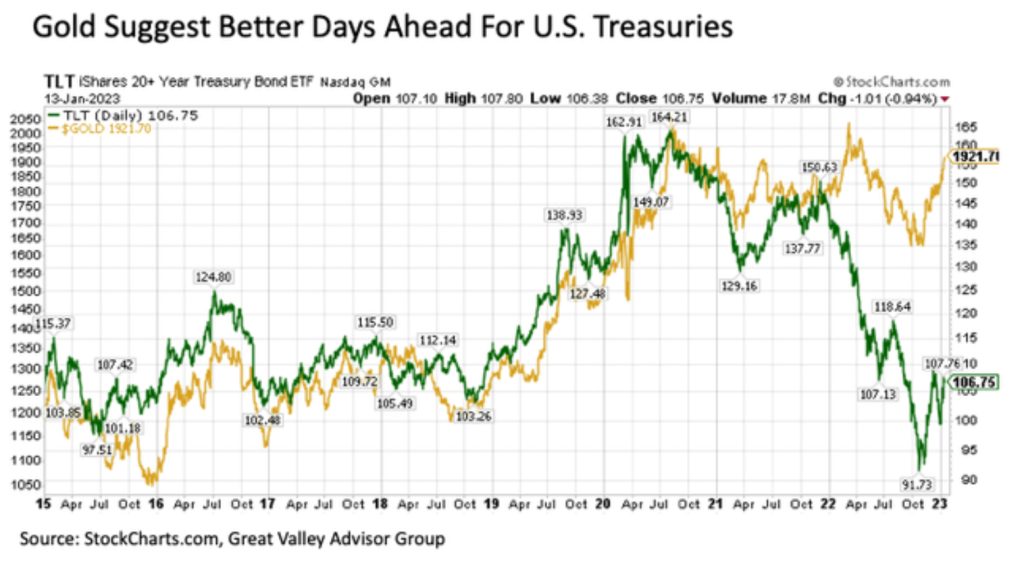
The gold price is also signaling that further upside may be ahead for U.S. Treasuries. What is the relationship between gold and Treasuries? The correlation of returns has actually been high for the last many years as shown in the chart above. What explains this strong positive relationship? While gold is widely regarded as an inflation hedge, it is actually more sensitive to expectations about monetary policy. In short, if it is anticipated that the Federal Reserve will move aggressively to tighten monetary policy in response to higher inflation, the threat of higher interest rates will often more than neutralize the inflation hedge upside associated with gold. This helps to explain why gold has been a lackluster performer at best during the inflation spike over the past two years. Conversely, gold historically has performed well during periods of easier monetary policy and the threat of economic, financial market, and/or geopolitical instability. These, of course, are the same factors that support Treasury prices.
This relationship in mind makes the divergence between gold and Treasuries notable over the past year. For while Treasuries plunged sharply to the downside, the gold price largely held its ground. This signals that inflationary pressures have been anticipated to be largely held in check, thus not necessitating the Federal Reserve to need to tighten too aggressively or for too long. If this is indeed the case and we see a reconvergence in the relationship between gold and Treasuries, this suggests meaningful upside for Treasuries as they catch up to the price currently implied by gold.
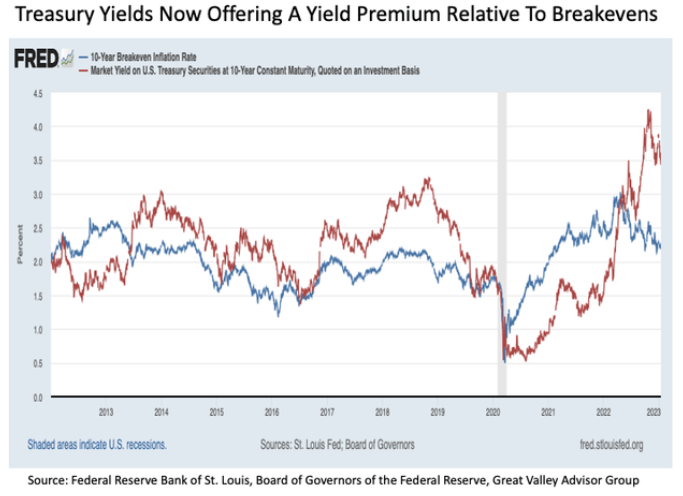
Adding further support to the notion that Treasuries have room to catch up to the upside is the fact that current yields remain well in excess of the breakeven inflation rate. To this point, the last time the 10-Year Treasury yield was trading at a comparable premium relative to the 10-Year Breakeven Inflation Rate was back in late 2018 when Treasury yields peaked at 3.25%. It is worth noting that the yield premium on offer today is still meaningfully higher than these late 2018 peaks even after the initial rebound in Treasury prices.
Bottom line. Inflationary pressures are increasingly coming down the other side of the mountain in the United States. While it may take some time for this positive development to be felt in the U.S. stock market, the favorable response may already be underway in the bond market in general and the Treasury market in particular. And the upside for the Treasury market may very well still be in its early stages.
Disclosure: I/we have a beneficial long position in the shares of TLT either through stock ownership, options, or other derivatives. I wrote this article myself, and it expresses my own opinions. I am not receiving compensation for it. I have no business relationship with any company whose stock is mentioned in this article.
Additional disclosure: Investment advice offered through Great Valley Advisor Group (GVA), a Registered Investment Advisor. Great Valley Advisor Group and Stonebridge Wealth Management are separate entities.
This is not intended to be used as tax or legal advice. Please consult a tax or legal professional for specific information and advice. Third party posts found on this profile do not reflect the views of GVA and have not been reviewed by GVA as to accuracy or completeness.
