Capital markets have had a remarkable run in recent weeks. After bottoming at the end of October, the S&P 500 Index has soared roughly +10%. The 10-Year U.S. Treasury yield has also plunged by more than a half percentage point since recently peaking at 5.00%, driving a comparable nearly +10% bounce in long-term U.S. Treasuries. Given these head turning gains for both stocks and bonds over such a short-term period of time, it is reasonable to consider what we should reasonably expect from here between now and when many across America are carving turkey for their Thanksgiving Day feasts.
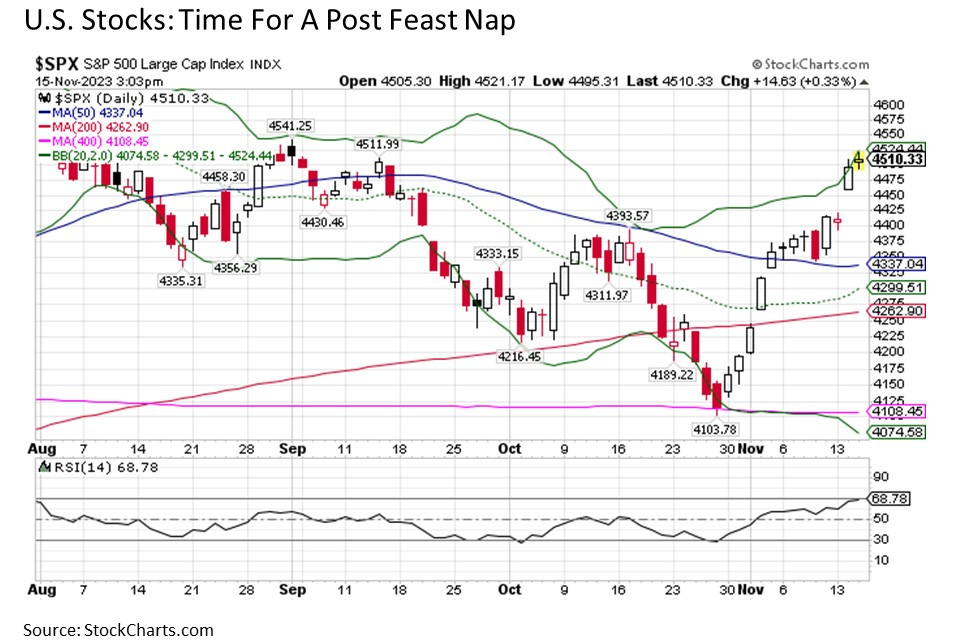
Eyes on the couch. The strength of the recent run in U.S. stocks cannot be overstated. After bottoming right at its ultra long-term 400-day moving average support (pink line below) on October 30, the S&P 500 exploded to the upside. This included gains in 11 out of the last 13 trading days, with five of these up days in excess of +0.90% and three greater than +1.50%. Put simply, stocks have been absolutely rockin’ in recent weeks.

But following such a strong advance over such a short period of time, we should not be surprised to see U.S. stocks take a breather as we coast into the Thanksgiving Day holiday. The S&P 500 is now effectively at overbought levels with an RSI reading close to 70, and the Index is at or above the top of its Bollinger Bands range, indicating that stocks would typically expect to be at or above current levels less than 2.5% of the time (or put differently, stocks would typically expect to be below current levels more than 97.5% of the time). As a result, don’t be surprised if we see U.S. stocks whip some of the froth off the top of the post rally feast coffee in the coming trading days.
This would not be a bad development by any means. Instead, it would be a healthy period of consolidation as part of a broader advance that may only be getting started through the remainder of the year and into 2024.
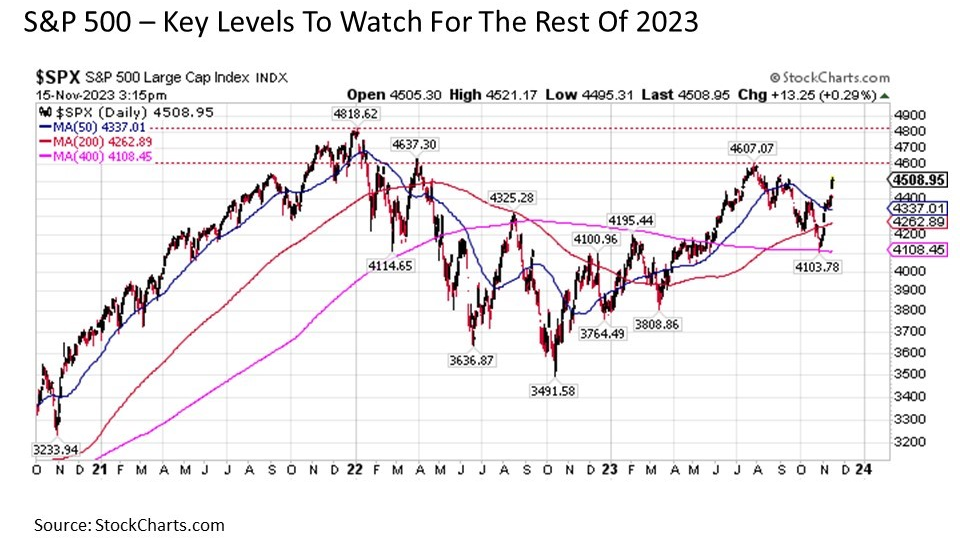
With this in mind, what are the key targets on the S&P 500 that investors should be watching in the coming weeks if the upside advance resumes after a short respite on the proverbial holiday couch? Two key levels in particular stand out. The first is 4607, which was the level reached by the S&P 500 at their late July 2023 peak before the August through October swoon got underway. The next is 4818, which is the all-time high on the S&P 500 reached back on January 4, 2022 before the most recent bear market got underway. Expect stocks to confront resistance at these two key technical levels, but if stocks were to break definitively above these key lines in the sand before the end of the year, this would be resoundingly bullish heading into 2024.

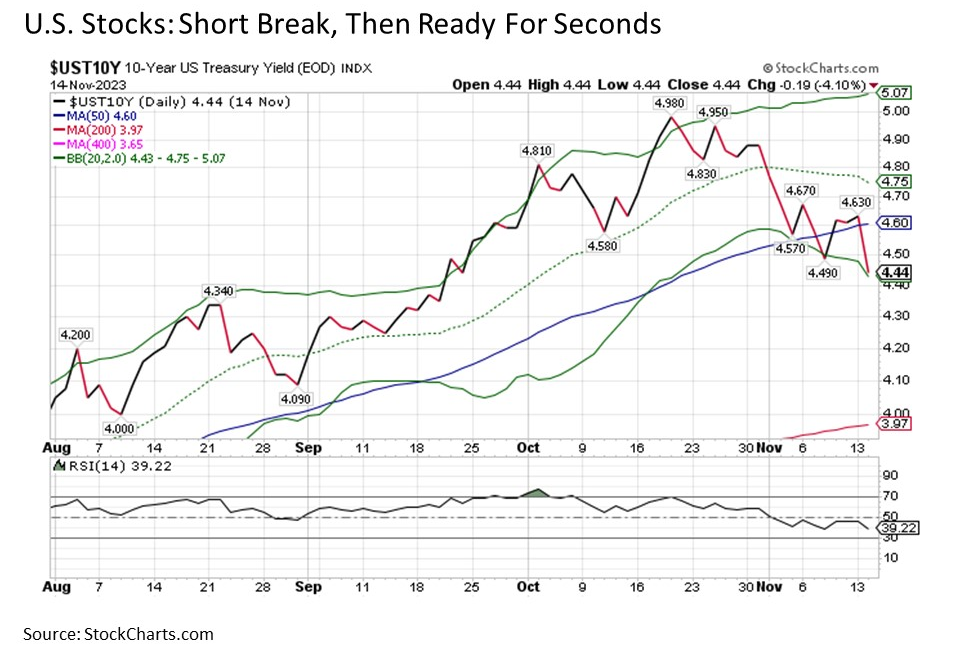
Time to watch the game. While stocks may now be ready for a short nap after the big rally feast, bonds may still be charged up enough to go back for more. Keeping in mind that as bond yields fall, bond prices rise, the fact that the 10-Year U.S. Treasury yield recently broke below strong 50-day moving average resistance now at 4.60% for the first time since the spring was a decidedly bullish development.

At the same time, the fact that the move lower in the 10-Year from 5.00% back in mid-October to as low as 4.44% today has been a more uneven back-and-forth move means that Treasury yields have not fallen too far, too fast. So as long as inflationary pressures continue to abate – the latest Consumer Price Index (CPI) readings from the U.S. Bureau of Labor Statistics were a definite step in the right direction in this regard – and Treasury yields continue their zig zag descent from recent highs suggests that bonds may have a good deal further to run through the rest of this year into 2024.
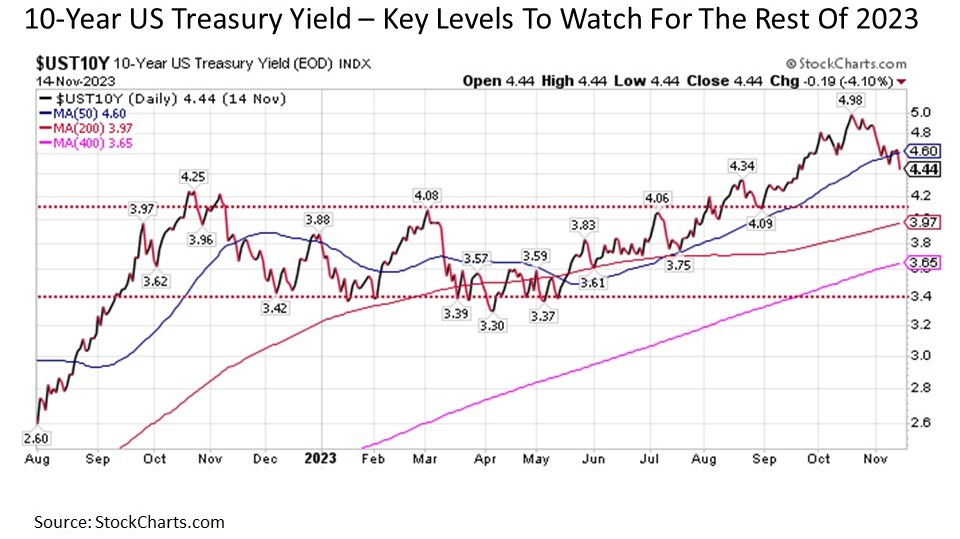
So what are the key levels worth watching on the 10-Year Treasury yield from where it stands today in the 4.50% neighborhood? The 10-Year yield recently burst out above a key trading range between 3.40% and 4.10% that had been in place from September 2022 through August 2023. As a result, it would not be unreasonable to expect the 10-Year yield to gradually descend and eventually return into this trading range. It’s worth noting that this move alone would imply a meaningful upside return across the bond market landscape. If and when the 10-Year returns to this range, it would be reasonable to expect a period of consolidation in this zone that could last as long as a few months as bonds sort out their next move. And if inflation pressures continue to fade in the months ahead, it would imply the 10-Year Treasury eventually settling in toward the lower end of this trading range if not potentially drifting below it.

Bottom line. Both stocks and bonds have been filled with a feast of notably strong returns since late October. And while a period of consolidation following recent gains is now overdue, the set up remains strong for stocks and bonds to continue their positive moves through the remainder of 2023 and into 2024.
Disclosure: I/we have no stock, option or similar derivative position in any of the companies mentioned, and no plans to initiate any such positions within the next 72 hours. I wrote this article myself, and it expresses my own opinions. I am not receiving compensation for it. I have no business relationship with any company whose stock is mentioned in this article. Investment advice offered through Great Valley Advisor Group (GVA), a Registered Investment Advisor. I am solely an investment advisor representative of Great Valley Advisor Group, and not affiliated with LPL Financial. Any opinions or views expressed by me are not those of LPL Financial. This is not intended to be used as tax or legal advice. All performance referenced is historical and is no guarantee of future results. All indices are unmanaged and may not be invested into directly. Please consult a tax or legal professional for specific information and advice.
Compliance Tracking: #506485-1
